Deploy PrometheusAlert
Copy
1
2
3
4
git clone https://github.com/feiyu563/PrometheusAlert.git
cd PrometheusAlert/example/helm/prometheusalert
# Update config/app.conf to set login user info and database configuration
helm install -n monitoring .
Create a WeChat Work Group Robot
After creating a WeChat Work group, right-click the group → “Add Group Robot”. This will generate a webhook URL for the robot. Record this URL for later use.
Prometheus Alert Configuration
Since I’m using https://github.com/prometheus-operator/kube-prometheus.git for Prometheus, directly modify the alertmanager-secret.yaml file. Add the webhook configuration under receivers:
Copy
 1
 2
 3
 4
 5
 6
 7
 8
 9
10
11
12
13
14
15
16
17
18
19
20
21
22
23
24
25
26
27
28
29
30
31
32
33
34
35
36
37
38
39
40
41
apiVersion : v1
data : {}
kind : Secret
type : Opaque
metadata :
name : alertmanager-main
namespace : monitoring
stringData :
alertmanager.yaml : |-
global:
resolve_timeout: "5m"
# Email settings
smtp_smarthost: 'smtp.exmail.qq.com:465' # SMTP server proxy
smtp_from: 'devops_alert@xxx.com' # Sender email address
smtp_auth_username: 'devops_alert@xxx.com' # Email username
smtp_auth_password: '1DevSop#' # Authorization password
smtp_require_tls: false # TLS disabled (default is enabled)
inhibit_rules:
- equal:
- namespace
- alertname
- instance
source_match:
severity: critical
target_match_re:
severity: warning|info
- equal:
- namespace
- alertname
- instance
source_match:
severity: warning
target_match_re:
severity: info
receivers:
- name: default
email_configs: # Email configuration
- to: "xxxx@163.com" # Recipient email for alerts
- name: jf-k8s-node
webhook_configs:
- url: "http://palert.con.sdi/prometheusalert?type=wx&tpl=jf-k8s-node&wxurl=https://qyapi.weixin.qq.com/cgi-bin/webhook/send?key=0da1f944-9a4e-4221-8036-f322351f7bd8"
Here’s an example of a disk usage alert rule:
Copy
 1
 2
 3
 4
 5
 6
 7
 8
 9
10
11
12
13
14
15
16
17
18
19
20
21
apiVersion : monitoring.coreos.com/v1
kind : PrometheusRule
metadata :
labels :
prometheus : k8s
role : alert-rules
name : external-node.rules
namespace : monitoring
spec :
groups :
- name : k8s-node.rules
rules :
- alert : 磁盘容量
expr : 100 -(node_filesystem_avail_bytes{instance=~'39.100.*',fstype=~"ext4|xfs|fuse.glusterfs"}/node_filesystem_size_bytes {fstype=~"ext4|xfs|fuse.glusterfs"}*100) > 96
for : 1m
labels :
severity : critical
app : node-alert
annotations :
summary : "{{$labels.mountpoint}} 磁盘分区使用率过高!"
description : "{{$labels.mountpoint }} 磁盘分区使用大于90%(目前使用:{{$value}}%)"
Customize Alert Templates
By default, Alertmanager uses its own template, which is not very effective. Here we unify the use of PrometheusAlert’s templates.
According to the official documentation, create a new template and specify the type as WeChat Work, purpose as Prometheus, with the following content:
Copy
 1
 2
 3
 4
 5
 6
 7
 8
 9
10
11
12
13
14
15
16
17
18
{{ $var := .externalURL}}{{ range $k,$v:=.alerts }}
#### [Prometheus Recovery Notification]({{$v.generatorURL}})
##### <font color="#FF0000">Alert Name</font>:[{{$v.labels.alertname}}]({{$var}})
##### <font color="#FF0000">Severity</font>:{{$v.labels.severity}}
##### <font color="#FF0000">Trigger Time</font>:{{GetCSTtime $v.startsAt}}
##### <font color="#02b340">Recovery Time</font>:{{GetCSTtime $v.endsAt}}
##### <font color="#FF0000">Instance</font>:{{$v.labels.instance}}
##### <font color="#FF0000">Details</font>:{{$v.annotations.description}}
#### [Prometheus Alert Notification]({{$v.generatorURL}})
##### <font color="#FF0000">Alert Name</font>:[{{$v.labels.alertname}}]({{$var}})
##### <font color="#FF0000">Severity</font>:{{$v.labels.severity}}
##### <font color="#FF0000">Trigger Time</font>:{{GetCSTtime $v.startsAt}}
##### <font color="#FF0000">Instance</font>:{{$v.labels.instance}}
##### <font color="#FF0000">Details</font>:{{$v.annotations.description}}
end }}
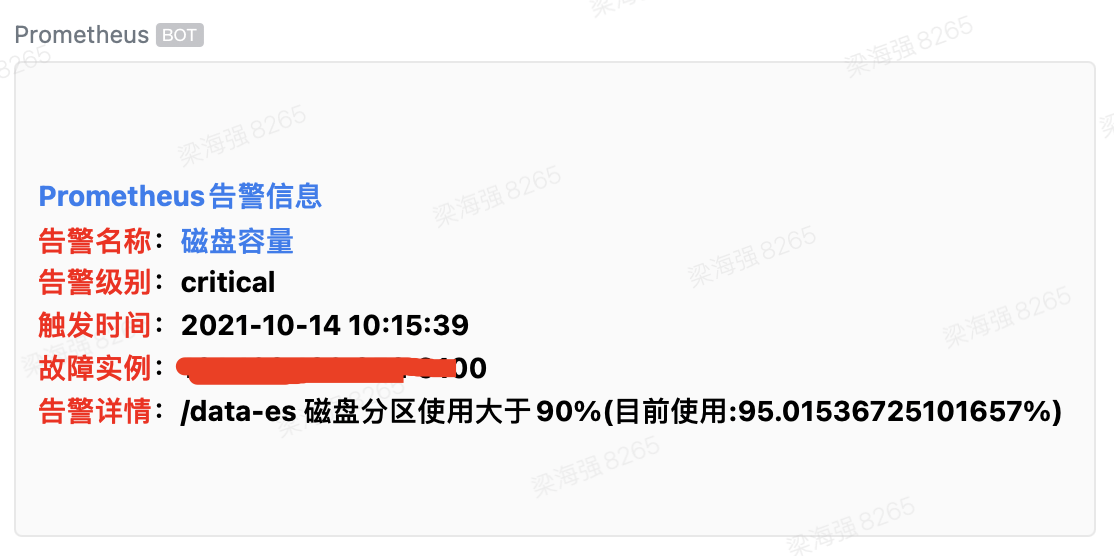
After triggering a disk space alert, the actual result appears as follows:
With this setup, PrometheusAlert has successfully received Prometheus alert messages and forwarded them to the WeChat Work group robot.
Additionally, for multi-cluster and multiple alert sources, the power of PrometheusAlert truly shines.